Infographics have taken the web by storm over the past several years and have become one of the most desirable ways of absorbing information for many users. Audiences love image-centric content that delivers valuable information and infographics meld those aspects along with “sharability” all into one.
If you’re looking to create an infographic for your own use, keep these design tips in mind:
1. Interesting Data
This point may seem obvious but can easily get overlooked if the infographic becomes over-designed or confusing. Always start with clear and compelling data that is unique and cohesive.
2. Let Color Guide You
Some datasets lend themselves more towards the use of many colors while others are better communicated using a limited palette. Consider the complexity of your data, how much you are working with, and what themes are behind your design.
3. Strong Fonts
Just because infographics are driven by information and statistics doesn’t mean that the text should be boring. In fact, an infographic allows you to do the opposite, displaying text in an interesting way with bold, fun, and unique fonts. Choose a variety but don’t go wild; too many fonts will cause your viewers to lose focus.
4. Make an Impact
Your information should be presented in such a way that the reader can grab important facts and tidbits at a glance. Achieve this by using large numbers and percentages, clean graphs and charts, and images that reflect your data.
5. Abide by Web Guidelines
Understanding how the infographic is going to be seen is crucial to design. Some browser windows stretch no wider than 735 pixels—and many mobile phones are even narrower. The length is at the designer’s discretion and depends on the amount of data. Always save your work at 72 dpi, in RGB, and as a PNG or JPEG file.
6. Use Citations
All of your data must be cited correctly. Don’t just grab statistics from a source without checking where it was originally derived. Get to the original source and provide all relevant information, including the web address if applicable.
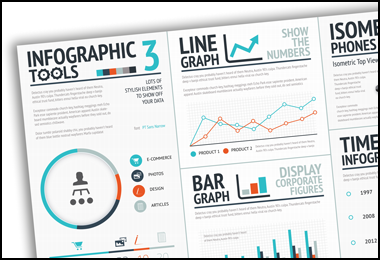
Having a graphic designer custom create your infographic is preferable. But if you are looking to build one on your own, here are a few tools to use:


Comments